The Oxford University podcasts have just published a couple of short video documentaries in their Openness at Oxford series; one about Open Data and one about Open Research. They feature numerous interesting practical examples from Oxford academics like Ben Goldacre and Danny Dorling talking about the importance of open access in research. If you want to see me have a mini rant about Excel ® (set to a soundtrack of Nutcracker no less) it starts at 11:20 in the first film.
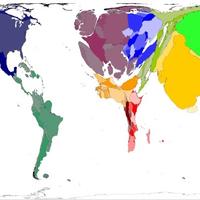
Some other highlights include astrophysicist Chris Lintott – also the head of the Citizen Science Alliance – describing how open data led a group of US climate sceptics to convince themselves that the temperature trends in the data were not the result of skulduggery. And Danny Dorling’s wonderful maps where the territory areas get resized based on the variable of interest – see an example below showing the number of elderly people over the age of 65.
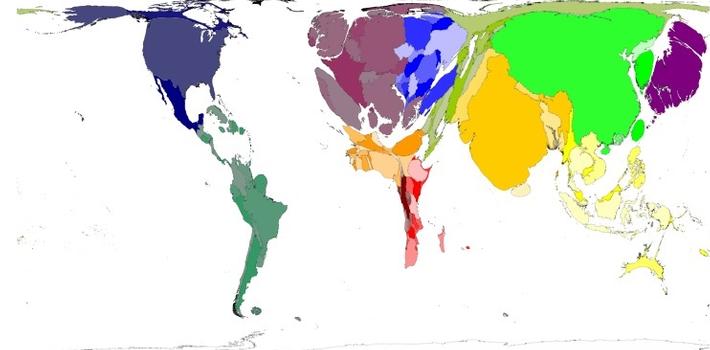
Figure: Worldwide distribution of people over 65 years old - Copyright Sasi Group (University of Sheffield) and Mark Newman (University of Michigan).
I discuss the Reinhart – Rogoff debacle where two Harvard economists committed (among other methodologically questionable decisions) an Excel spreadsheet error that only got discovered after several years of the paper having considerable policy influence. Which is an excellent example of the need for open data, open research and general reproducibility of published findings. I also talk about using github as an online open repository for data and analysis and wax lyrical about its advantages in collaborative research in particular.
As is to be expected I had a massive case of l'esprit de l'escalier after filming the interview. I had completely forgotten to mention one of my pet peeves: the actual usability of nominally freely available data. Just because someone has gone to the trouble of collecting and publishing data, does not automatically make the information easily retrievable. Luckily Ben Goldacre does mention the topic of “good information hygiene” i.e. the importance of making information actually discoverable and useable. He gives the example of data being published in a scanned pdf that is not searchable, and has no index or table of contents. All too painfully familiar. But while he is describing a potentially intentional attempt at obfuscation he has encountered in the field of medical trials, there are also a bewildering number of cases where well intentioned agencies simply give no consideration to how the data they are releasing might be used.
To give you an example, I recently did some work using UK 2011 Census tables for Output Area statistics. An amazing data set, with detailed counts for hundreds of variables for over 230,000 output areas (OAs) in the UK, all free, open and in .csv format. What could possibly go wrong? Well, it turns out these were effectively Excel files (see a pattern here?) simply saved as .csv files. Which I noticed trying to import them into R, because the files had multiple header rows, random numbers of extra empty rows and columns appended at the end and differently formatted values for Scottish OAs (using 1000 comma separators!).
I wrote to enquire about this egregious flouting of (albeit informal) .csv standards and was told by Census Customer Services “[t]here was no intent to create tables only readable in Excel, and then save them to CSV form, but only an effort made to alter or disturb the separate country data as little as possible.” Well intentioned, it seems, but definitely not good practice. In fact had they published the data in .xls files, none of these issues would have shown up. Saving them as .csv files ended up causing more issues than it solved, and is nothing more than a token gesture to open data.
I encountered an even more extreme example a couple of weeks ago, when a friend asked me to help him pry some data out of a very convoluted .xml file. I won’t mention the public service agency that had compiled the offending data, but after I somehow managed to get it out in a useable format, my friend’s response was: “A minister gave an answer to parliamentary question insisting that what you’ve just shown to exist just cannot exist”. In his experience with administrative “open data movements” there is a common disconnect between people who manage administrative data and people (even within the same government structures), who want to analyse them. The former just cannot fathom the potential of the information they are sitting on and therefore do not make the slightest effort to share it in an accessible format.
In the best of times data analysis involves a lot more data cleaning or “janitor work” than any reasonable person would care to engage in. When data managers do not consider their audiences in preparing appropriate data formats and relevant meta information they are treating open data as an empty platitude. With persistence most everything can get unscrambled in the end, but at the cost of wasted time, money and an ever increasing cynicism about the illusion of open data.
About the Author
Dr Maja Založnik s a demographer currently working on a joint project of the Oxford Institute of Population Ageing and the Oxford Martin Programme on the Future of Food.
Opinions of the blogger is their own and not endorsed by the Institute
Comments Welcome: We welcome your comments on this or any of the Institute's blog posts. Please feel free to email comments to be posted on your behalf to administrator@ageing.ox.ac.uk or use the Disqus facility linked below.
_square_xs.jpg)


_square_xs.jpg)