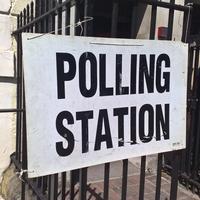
On Thursday the nation will, once again, head to the polling booths. As a statistician and demographer (as well as a voter under the age of 35), the difference in voting patterns by age is one of the most interesting things about this election. There is an old adage that you get more conservative (with a big and a small “c”) as you get older. Furthermore, the pollsters are now arguing that the result of the election hinges on young people turning out to vote (or not, as the case may be). Furthermore, one reason they got it so wrong in the last general election is that they over sampled politically engaged young people, thus failing to properly account for disengaged young people who did not vote. This election is being used by pollsters to test out new methods, resulting in predictions ranging from a hung parliament to substantial Conservative gains.
But, just how big is the demographic divide? According to a recent YouGov / Sunday Time poll, the demographic divide is more a gaping chasm than a divide. Among those aged 18-24 71% intend to vote Labour, while just 19% of those aged 65+ intend to vote Labour. A mere 15% of 18-24 year olds intend to vote Conservative, while Labour is comfortably ahead for all those aged under 50. When asked “do you think that Theresa May is doing well or badly as Prime Minister?” 70% of those aged 18-24 said she was doing badly, compared to just 27% aged 65+.
A more metaphorical approach to this issue can be seen in answers to questions about which animals most resemble May and Corbyn. 18-24 year olds see Corbyn as a Labrador or tortoise, while older voters are most likely to describe him as a snake. May is overwhelmingly described as a snake by younger voters, whereas older voters see her as a bulldog or a lion.

Source: YouGov / Sunday Times Survey, 1st-2nd June 2017
However you look at it, the demographic divide in voting intentions is startling. Furthermore, it appears to have widened substantially since the last general election. According to a similar YouGov poll run just before the 2015 election, a mere 40% of 18-24 year olds intended to vote Labour, with just 41% of those aged 65+ intending to vote Conservative. In the two years since the last General Election we have seen a realignment of voting patterns as a result of the Brexit referendum, where younger voters were more likely to vote remain, but less likely to vote. In 2015 young voters were 35 percentage points less likely to turnout than older voters, while the turnout gap was even larger for the Brexit referendum. Such a large turnout gap underlines the potential for younger voters to make a difference. But, will younger voters be galvanised into action by this or will they be further disengaged? We will only find out for sure once the votes have been counted.
About the Author:
Dr Melanie Channon (nee Frost) is a Research Fellow at the Oxford Institute of Population Ageing working on the Collen Programme. Melanie is a trained demographer and social statistician, and her primary areas of research interest are the drivers of fertility transition in developing countries, son preference, and gender statistics. She has expertise in the demography of both Asia and Africa, with a focus on Nepal and South Asia.
Comments Welcome:
We welcome your comments on this or any of the Institute's blog posts. Please feel free to email comments to be posted on your behalf to administrator@ageing.ox.ac.uk or use the Disqus facility linked below.
Opinions of the blogger is their own and not endorsed by the Institute
Comments Welcome: We welcome your comments on this or any of the Institute's blog posts. Please feel free to email comments to be posted on your behalf to administrator@ageing.ox.ac.uk or use the Disqus facility linked below.


