
Official statistics in the UK measure pensioner poverty in two basic ways - either by looking at the income of pensioner households/individuals relative to the UK median income or by looking at a measure of material deprivation (whether or not household income allows people to buy items in a selected basket of goods). The data used to classify households as living in poverty or materially deprived come from one source, the Family Resources Survey, which is conducted with a large representative sample of households and usually includes about 7,000 pensioner households.
Income-based measures
Every year the Department of Work and Pensions uses the FRS to produce statistics on Households Below Average Income (HBAI). This refers to households with an income of less than 60% of the median for the UK. HBAI looks at trends in what it calls ‘absolute low income’ as well as ‘relative low income’. The terminology is potentially misleading as they are both measures of relative poverty. What differentiates them is the year chosen as the standard of comparison. For ‘absolute low income’, household income now is measured against 60% of the UK household median for a fixed year (2010-11); for ‘relative low income’, against 60% of the contemporary UK median.
This means that if pensioner households enjoy an increase in real income (i.e. adjusted for inflation) over a given period, there will be fewer of them living with absolute low income, but if this increase is less than that enjoyed UK households as a whole, then there will be more of them living with relative low income. What actually happened is somewhat different from this (fig 1). The percentage of households with absolute low income has remained more or less stable since the recession, but the percentage with relative low income has increased since 2011-12 (though it is still lower than what it was in the years before the recession).
.png)
The majority (80%) of pensioners own their homes and ~ 5 % of these are still repaying a mortgage. This percentage has not increased since 2000. The likelihood of homeowners having below average income is more or less the same whether they own outright are still repaying a mortgage.
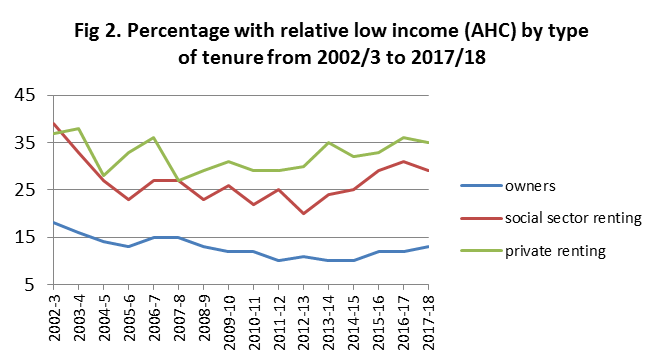
The Institute of Fiscal Studies in its 2019 annual report on Living Standards, Poverty and Inequality considered two factors that seemed to contribute to the rise in pensioner poverty: a fall in income from private pensions and an increase in average housing costs.
How to explain the fall in income from private pensions? It seems that there has been a fall in the share of pensioners with private pensions in both younger and older age groups (i.e. 65-69 and 80+). And as the authors point out, this is something of a puzzle. The fall among younger pensioners may be explained by more people taking advantage of new regulations that allow them to take their accumulated pensions savings as a lump sum rather than annuitizing - but not for older pensioners who would already have annuitized. The puzzle is enough to suggest that there might be is an issue with data quality.
.png)
https://www.ifs.org.uk/publications/14193
The data on housing costs are more straightforward. In the years between 1997 and 2011 the effect of rising rents on average housing costs (for pensioners in the lowest income quartile) was offset by the increasing percentage of homeowners in successive cohorts of pensioners. After 2011, rents in both private accommodation and social housing continued to rise as homeownership rates stabilised among newer cohorts of pensioners. What has also happened is that the ratio of pensioners renting in the private sector has increased relative to those in social housing.
It is of course possible to choose thresholds for income poverty other than 60% of the median. Thus the IFS report and Bernard Ebbinghaus (Oxford) give statistics for households with incomes less than 40% of the UK medianb and refer to this as severe poverty. As the IFS notes, some people with relatively low relative incomes may have savings which they can draw on for consumption and it is useful therefore to look at expenditure as well as income. For this they construct a measure of expenditure poverty, which is like income poverty in that it looks at spending relative to the median. It turns out that people with the very lowest relative incomes (<10%) are less likely to report expenditure poverty (<50% of UK median) than people with somewhat higher incomes.
Material deprivation
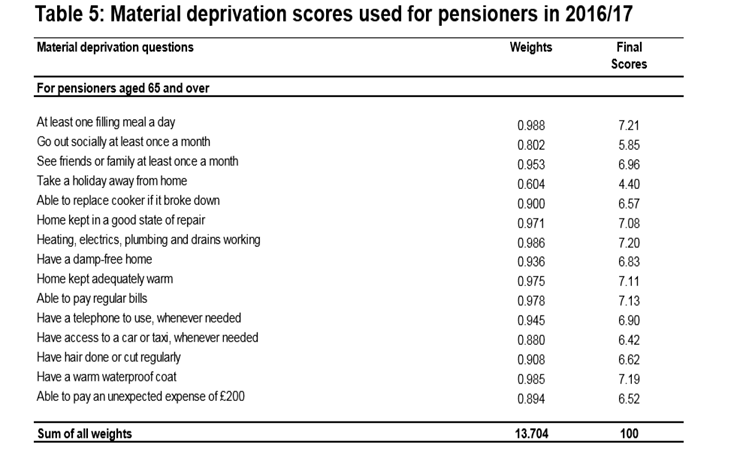
Statistics on material deprivation are a relatively recent innovation in the FRS, first measured for pensioners in 2009-10 (2004-5 for children). The idea is to construct a suite of questions that constitute the best discriminator between households that are deprived and those that are not. The focus here is not income but consumption. Respondents are asked whether they have access to 15 goods and services, and also why they lack access (as we might expect, the items are different for children and pensioners).
If they lack access for some other reason besides lack of desire (i.e. don’t want it), they count as deprived. These other reasons may include poor health or the effort required to secure access or the lack of someone to help with securing access; in other words, pensioners may count as deprived for reasons other than lack of money. Scores for each item (0 or 1) are prevalence-weightedc and divided by the maximum total score (13.704 in table below) and then summed to obtain a continuous distribution of scores from 0 to 1 (multiplied by 100 to make them easier to interpret). Households with a score above a selected threshold (in this case 20) are materially deprived.
Between 2009-10 and 2017-18 the percentage of materially deprived pensioners fell from 10% to 7%. As for individual items, the largest falls were in those that were less commonly afforded in the entire population in 2010–11: going out socially at least once a month or taking a week-long holiday at least once a year. This fall in rates of material deprivation is important and is taken as support for the view (or call it a hypothesis) that there may be a data quality issue underlying the apparent rise in pensioners’ income poverty.
A new measure from the Social Metrics Commission (SMC)
In 2018, the SMC published its final report on a new poverty metric which :
- Takes account of all material resources, not just incomes. For instance, this means including an assessment of the available assets that families have;
- Accounts for the inescapable costs that some families face, which make them more likely than others to experience poverty. These include, the extra costs of disability, and costs of childcare and rental and mortgage costs;
- Broadens the approach of poverty measurement to include an assessment of housing adequacy. For example, by regarding those sleeping rough as being in poverty;
- Positions the measure of poverty within a wider measurement framework, which allows us to understand more about the nature of poverty in the UK.
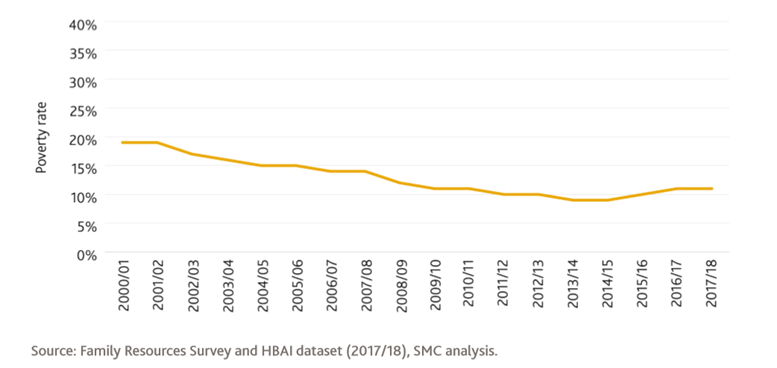
What they end up with is a measure of resources available to meet needs that tries to take better account of both resources available (e.g. debt as well as savings) and needs (e.g. costs of childcare or disability). It differs from other measures in two further ways. Firstly, the commissioners decided to adopt a 3-year smoothing period which means that the ‘benchmark of social norms’ is a 3-year lagged average of median resources available rather than a single year - e.g. the current year. Secondly, the poverty threshold is set at 55% of the ‘benchmark of social norms’.
Like the HBAI data, their data for pensioners comes from the FRS (they use Understanding Society to measure persistent poverty). For 2017, their headline finding was that “far fewer pensioners are living in poverty than previous measures suggested”. Moreover, the difference between pensioner poverty rates (11.4%) and rates in the general population (22%) was larger than previous measures suggested. In 2018 (report published last year) the rate fell to 11% (from 1.4m to 1.3m).
aAHC = after housing costs. HBAI statistics report income before & after housing costs. Because housing costs affect different groups of pensioners differently, I have included AHc figures here.
bFor the population as a whole this has increased more than relative poverty at the 60% threshold, but they don’t give detailed breakdowns for trends among pensioners. What they do make clear is that pensioners make up a smaller proportion of households in relative poverty as the threshold is lowered from 60% to 40%.
cPrevalence-weighting means that more weight is given to those items that most pensioner households have. So one filling meal a day has a greater weighting than a holiday away from home.
About the Author:
Kenneth Howse is a Senior Research Fellow at the Oxford Institute of Population Ageing. He is also a key member of The Collen Programme on Fertility, Education and the Environment.
Opinions of the blogger is their own and not endorsed by the Institute
Comments Welcome: We welcome your comments on this or any of the Institute's blog posts. Please feel free to email comments to be posted on your behalf to administrator@ageing.ox.ac.uk or use the Disqus facility linked below.
_square_xs.jpg)


_square_xs.jpg)